D3进阶
加载外部数据
加载csv数据,可以通过d3.csv(data,function) 进行操作 加载json数据,跟上面是一样的,只需要将csv改为json就行
 d3.csv('./data.csv').then((result) => {
    var container = d3.select("#app");
    container.selectAll('h1')
      .data(result.columns)
      .enter()
      .append('h1')
      .text(function (d) {
        return d;
      })
 })
data.csv
10,20,30,40,50,60
比例尺的使用
D3中有个重要的概念就是比例尺。比例尺就是把一组输入域映射到输出域的函数。映射就是两个数据集之间元素相互对应的关系。比如输入是1,输出是100,输入是5,输出是10000,那么这其中的映射关系就是你所定义的比例尺。
D3中有各种比例尺函数,有连续性的,有非连续性的,本文对于常用比例尺进行一一介绍。
1. d3.scaleLinear() 线性比例尺
使用d3.scaleLinear()创造一个线性比例尺,而domain()是输入域,range()是输出域,相当于将domain中的数据集映射到range的数据集中。
let scale = d3.scaleLinear().domain([1,5]).range([0,100])
映射关系:

接下来,我们来研究这个比例尺的输入和输出。
scale(1) // 输出:0
scale(4) // 输出:75
scale(5) // 输出:100
刚才的输入都是使用了domain区域里的数据,那么使用区域外的数据会得出什么结果呢?
scale(-1) // 输出:-50
scale(10) // 输出:225
所以这只是定义了一个映射规则,映射的输入值并不局限于domain()中的输入域。
2. d3.scaleBand() 序数比例尺
d3.scaleBand()并不是一个连续性的比例尺,domain()中使用一个数组,不过range()需要是一个连续域。
let scale = d3.scaleBand().domain([1,2,3,4]).range([0,100])
映射关系:
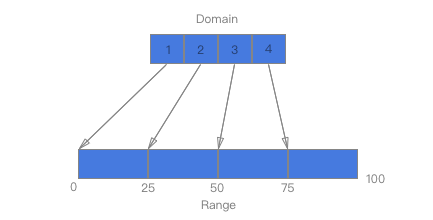
看一下输入与输出:
scale(1) // 输出:0
scale(2) // 输出:25
scale(4) // 输出:75
当输入不是domain()中的数据集时:
scale(0)  // 输出:undefined
scale(10) // 输出:undefined
由此可见,d3.scaleBand()只针对domain()中的数据集映射相应的值。
3. d3.scaleOrdinal() 序数比例尺
d3.scaleOrdinal()的输入域和输出域都使用离散的数据。
let scale = d3.scaleOrdinal().domain(['jack', 'rose', 'john']).range([10, 20, 30])
映射关系:
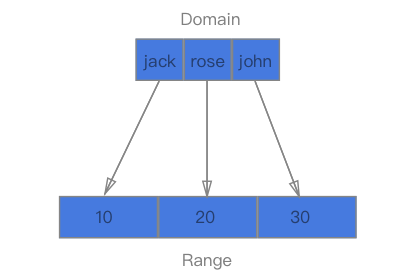
输入与输出:
scale('jack') // 输出:10
scale('rose') // 输出:20
scale('john') // 输出:30
当输入不是domain()中的数据集时:
scale('tom') // 输出:10
scale('trump') // 输出:20
输入不相关的数据依然可以输出值。所以在使用时,要注意输入数据的正确性。
我们从上面的映射关系中可以看出,domain()和range()的数据是一一对应的,如果两边的值不一样呢?下面两张图说明这个问题:
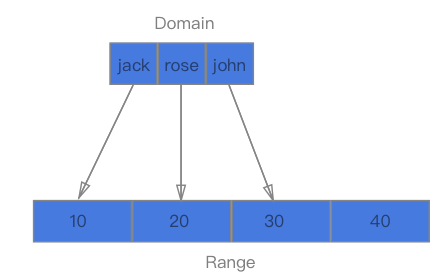
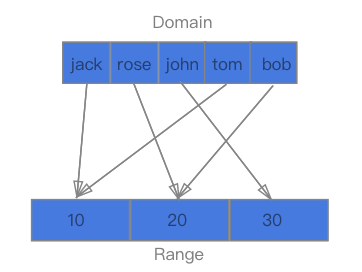
domain()的值按照顺序循环依次对应range()的值。
4. d3.scaleQuantize() 量化比例尺
d3.scaleQuantize()也属于连续性比例尺。定义域是连续的,而输出域是离散的。
let scale = d3.scaleQuantize().domain([0, 10]).range(['small', 'medium', 'long'])
映射关系:
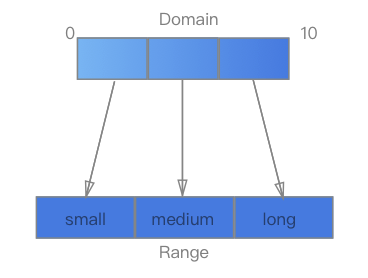
输入与输出:
scale(1) // 输出:small
scale(5.5) // 输出:medium
scale(8) // 输出:long
而对于domain()域外的情况:
scale(-10) // 输出:small
scale(10) // 输出:long
大概就是对于domain()域的两侧的延展。
5. d3.scaleTime() 时间比例尺
d3.scaleTime()类似于d3.scaleLinear()线性比例尺,只不过输入域变成了一个时间轴。
let scale = d3.scaleTime()
              .domain([new Date(2020, 2, 20, 0), new Date(2020, 2, 20, 2)])
              .range([0,100])
输入与输出:
scale(new Date(2020, 2, 20, 0)) // 输出:0
scale(new Date(2020, 2, 20, 1)) // 输出:50
时间比例尺较多用在根据时间顺序变化的数据上。另外有一个d3.scaleUtc()是依据世界标准时间(UTC)来计算的。
6. 颜色比例尺
D3提供了一些颜色比例尺,10就是10种颜色,20就是20种:
d3.schemeCategory10
d3.schemeCategory20
d3.schemeCategory20b
d3.schemeCategory20c
// 定义一个序数颜色比例尺
let color = d3.scaleOrdinal(d3.schemeCategory10)
7. 其他比例尺
另外有一些函数比例尺的功能,从名称上就可见一斑。
d3.scaleIdentity() // 恒等比例尺
d3.scaleSqrt() // 乘方比例尺
d3.scalePow() // 类似scaleSqrt的乘方比例尺
d3.scaleLog() // 对数比例尺
d3.scaleQuantile() // 分位数比例尺
8. invert()与invertExtent()方法
上述的各种使用比例尺的例子都相当于一个正序的过程,从domain的数据集映射到range数据集中,那么有没有逆序的过程呢?D3中提供了invert()以及invertExtent()方法可以实现这个过程。
let scale = d3.scaleLinear().domain([1,5]).range([0,100])
scale.invert(50) // 输出:3
let scale2 = d3.scaleQuantize().domain([0,10]).range(['small', 'big'])
scale2.invertExtent('small') // 输出:[0,5]
不过,值得注意的是,这两种方法只针对连续性比例尺有效,即domain()域为连续性数据集的比例尺。那么非连续性的比例尺就没有invert()方法了吗?
收尾
到此,对于D3V4版本中的常见比例尺的映射关系都进行了介绍,而各个比例尺还提供了许多其他功能,比如在绘制坐标轴中用到的ticks(),tickFormat()等功能,具体API可以参见此处。关于第8点最后提出的问题,请听下回分解。
给柱形图添加比例尺
<script>
    var datalist = [10, 20, 30, 40, 50];

    const linear = d3.scaleLinear()
      .domain([0, d3.max(datalist)])
      .range([0, 400]);

    var container = d3.select("#app");

    container.selectAll('rect')
      .data(datalist)
      .enter()
      .append('rect')
      .classed('bar', true)
      .style('height', function (d, i) {
        return linear(d) - 10 + 'px';
      })
      .attr('x', function (d, i) {
        return i * 35 + 'px';
      })
      .attr('width', function (d, i) {
        return 30 + 'px';
      })
      .attr('y', function (d, i) {
        return 400 - linear(d) + 5 + 'px';
      })
      .append('text')
      .text(function (d) {
        return d;
      })
      .style('color', function (d) {
        if (d > 30) {
          return 'red';
        }
      })
  </script>
进一步完善,添加序数比例尺:
<script>

    var datalist = [5, 10, 20, 30, 40, 50];
    //线性比例尺
    const linear = d3.scaleLinear()
      .domain([2, d3.max(datalist)])
      .range([2, 398]);

    //序数比例尺
    const scaleBand = d3.scaleBand()
      .domain(d3.range(0, datalist.length))
      .range([2, 498])
      .paddingInner(0.05);

    var container = d3.select("#app");

    container.selectAll('rect')
      .data(datalist)
      .enter()
      .append('rect')
      .classed('bar', true)
      .style('height', function (d, i) {
        return linear(d) - 10 + 'px';
      })
      .attr('x', function (d, i) {
        return scaleBand(i) + 'px';
      })
      .attr('width', function (d, i) {
        return scaleBand.bandwidth() + 'px';
      })
      .attr('y', function (d, i) {
        return 400 - linear(d) + 5 + 'px';
      })
      .append('text')
      .text(function (d) {
        return d;
      })
      .style('color', function (d) {
        if (d > 30) {
          return 'red';
        }
      })
  </script>
坐标轴
坐标轴,是可视化图表中经常出现的一种图形,由一些列线段和刻度组成。坐标轴在 SVG 中是没有现成的图形元素的,需要用其他的元素组合构成。D3 提供了坐标轴的组件,如此在 SVG 画布中绘制坐标轴变得像添加一个普通元素一样简单。
坐标轴由什么构成
坐标轴在可视化图形中是很重要的一部分,很多图表的展示都需要使用坐标轴,例如:柱形图、折线图。
D3中的坐标轴:
SVG 画布的预定义元素里,有六种基本图形:
- 矩形
- 圆形
- 椭圆
- 线段
- 折线
- 多边形
还有一种比较特殊的存在,也是最强的元素:
- 路径
所以说,在D3种是没有现成的坐标轴组件的,需要我们使用别的方式使用坐标轴。
我们可以使用类似下面的方式:
<g>
<!-- 第一个刻度 -->
<g>
<line></line>   <!-- 第一个刻度的直线 -->
<text></text>   <!-- 第一个刻度的文字 -->
</g>
<!-- 第二个刻度 -->
<g>
<line></line>   <!-- 第二个刻度的直线 -->
<text></text>   <!-- 第二个刻度的文字 -->
</g>
...
<!-- 坐标轴的轴线 -->
<path></path>
</g>
分组元素 ,是 SVG 画布中的元素,意思是 group。此元素是将其他元素进行组合的容器,在这里是用于将坐标轴的其他元素分组存放。
如果需要手动添加这些元素就太麻烦了,为此,D3 提供了一个组件:d3.axisBottom(xScale)。它为我们完成了以上工作。
使用坐标轴
定义坐标轴
坐标轴通常需要和比例尺一起使用:
// 为坐标轴定义一个线性比例尺
var xScale = d3.scaleLinear()
    .domain([0, d3.max(dataset)])
    .range([0, 250]);
// 定义一个坐标轴
var xAxis = d3.axisBottom(xScale) //定义一个axis,由bottom可知,是朝下的
    .ticks(7); //设置刻度数目
定义坐标轴相关的函数:
- d3.svgAxis():D3 中坐标轴的组件,能够在 SVG 中生成组成坐标轴的元素。
- scale():指定比例尺。
- orient():指定刻度的朝向,bottom 表示在坐标轴的下方显示。
- ticks():指定刻度的数量。
添加坐标轴
上面我们定义好了坐标轴,接下来就是将其添加到画布中去。
svg.append("g")
   .call(axis);
上面有一个 call() 函数,其参数是前面定义的坐标轴 axis。
设定坐标轴的样式和位置
默认的坐标轴样式不太美观,下面提供一个常见的样式:
<style>
.axis path,
.axis line{
    fill: none;
    stroke: black;
    shape-rendering: crispEdges;
}

.axis text {
    font-family: sans-serif;
    font-size: 11px;
}
</style>
分别定义了类 axis 下的 path、line、text 元素的样式。接下来,只需要将坐标轴的类设定为 axis 即可。 坐标轴的位置,可以通过 transform 属性来设定。 通常在添加元素的时候就一并设定,写成如下形式:
svg.append("g")
  .attr("class","axis")
  .attr("transform","translate(20,130)")
  .call(axis)
完整的实例
<!DOCTYPE html>
<html>

<head>
    <title>比例尺与坐标轴</title>

    <script type="text/javascript" src="http://d3js.org/d3.v5.min.js">
    </script>

    <meta name="keywords" content="keyword1,keyword2,keyword3">
    <meta name="description" content="this is my page">
    <meta name="content-type" content="text/html; charset=UTF-8">

    <style>
        .axis path,
        .axis line {
            fill: none;
            stroke: black;
            shape-rendering: crispEdges;
        }

        .axis text {
            font-family: sans-serif;
            font-size: 11px;
        }
    </style>

</head>

<body>

  <svg width="960" height="600"></svg>
    <script>
        // 2、定义画布位置
        var marge = { top: 60, bottom: 60, left: 60, right: 60 }

        // 4、定义比例尺,才能绘制彩条
        // 定义线性比例尺
        var dataset = [2.5, 2.1, 1.7, 1.3, 0.9];
        var scaleLinear = d3.scaleLinear()
            .domain([0, d3.max(dataset)])
            .range([0, 250]);

        // 定义序列比例尺
        var index = [0, 1, 2, 3, 4];
        var color = ["red", "blue", "green", "yellow", "black"];

        var ordinal = d3.scaleOrdinal()
            .domain(index)
            .range(color);

        ordinal(0); //返回 red
        ordinal(2); //返回 green
        ordinal(4); //返回 black

        // 1、线绘制画布
        var svg = d3.select("svg");
        var g = svg.append("g")
            .attr("transform", "translate(" + marge.top + "," + marge.left + ")");// 设置画布的位置

        // 3、定义矩形条的高度
        var rectHeight = 30;

        g.selectAll("rect")
          .data(dataset)
          .enter()
          .append("rect")
          .attr("x", 20)
          .attr("y", function (d, i) {
              return i * rectHeight;
          })
          .attr("width", function (d) {
              return scaleLinear(d);
          })
          .attr("height", rectHeight - 5)
          .attr("fill", function (d) {
              return ordinal(d);  // 这里使用比例尺,来为每个矩形填充颜色
          });

        // 5、定义坐标轴
        // 为坐标轴定义一个线性比例尺
        var xScale = d3.scaleLinear()
          .domain([0, d3.max(dataset)])
          .range([0, 250])

        // 定义一个坐标轴
        var xAxis = d3.axisBottom(xScale)//定义一个axis,由bottom可知,是朝下的
          .ticks(7)//设置刻度数目

        g.append("g")
          .attr("class","axis") // 6、最后一步,为坐标轴定义样式
          .attr("transform", "translate(" + 20 + "," + (dataset.length * rectHeight) + ")")
          .call(xAxis)
    </script>
</body>
</html>
完整的柱形图
<!DOCTYPE html>
<html lang="en">

<head>
  <meta charset="UTF-8">
  <meta name="viewport" content="width=device-width, initial-scale=1.0">
  <meta http-equiv="X-UA-Compatible" content="ie=edge">
  <title>Document</title>
  <script src="http://d3js.org/d3.v5.min.js"></script>
  <style>
    #app {
      margin: 0 auto;
      width: 500px;
      height: 400px;
      background: #efefef;
      position: relative;
    }

    .bar {
      /* width: 30px; */
      /* height: 50px; */
      fill: green;
      position: absolute;
      bottom: 100px;
    }

    .bar span {
      display: block;
      text-align: center;
    }
  </style>
</head>

<body>
  <svg id="app" style="width: 500px; height:400;"></svg>

  <script>

    const SVG_HEIGHT = 400;
    const SVG_WIDTH = 500;
    const MARGIN = { TOP: 30, RIGHT: 30, BOTTOM: 30, LEFT: 30 }

    //模拟数据
    var datalist = [20, 30, 40, 50, 15]

    //容器(画布)
    var container = d3.select("#app")

    //线性比例尺
    const yScale = d3.scaleLinear()
      .domain([0, d3.max(datalist)])
      .range([SVG_HEIGHT - MARGIN.TOP - MARGIN.BOTTOM, 0])

    var axisLeft = d3.axisLeft(yScale)

    //序数比例尺
    var xScale = d3.scaleBand()
      .domain(d3.range(datalist.length))
      .range([0, SVG_WIDTH - MARGIN.LEFT - MARGIN.RIGHT])
      .paddingInner(0.1)

    //x轴比例尺展示无意义
    var axisBottom = d3.axisBottom(xScale)

    axisBottom(
      container.append('g')
        .attr('transform', `translate(${MARGIN.LEFT},${SVG_HEIGHT - MARGIN.TOP})`))

    axisLeft(
      container
        .append('g')
        .attr('transform', 'translate(30,30)')
    )

    container.selectAll('rect')
      .data(datalist)
      .enter()
      .append('rect')
      .classed('bar', true)

      .attr('x', function (d, i) {
        return xScale(i) + MARGIN.LEFT + 'px';
      })
      .attr('width', function (d, i) {
        return xScale.bandwidth() + 'px';
      })
      .attr('y', function (d, i) {
        return SVG_HEIGHT - MARGIN.TOP + 'px';
      })
      .attr('height', function () {
        return 0
      })
      .transition()
      .duration(1000)
      .delay(function (d, i) {
        return i * 200
      })
      .attr('y', function (d, i) {
        return yScale(d) + MARGIN.TOP + 'px';
      })
      .style('height', function (d, i) {
        return SVG_HEIGHT - MARGIN.TOP - MARGIN.BOTTOM - yScale(d) + 'px';
      })

    container.append('g').attr('class', 'textGrop')

    d3.select('.textGrop')
      .selectAll('text')
      .data(datalist)
      .enter()
      .append('text')
      .attr('text-anchor', 'middle')
      .text(function (d, i) {
        return d
      })
      .attr('x', function (d, i) {
        return xScale(i) + MARGIN.LEFT + xScale.bandwidth() / 2 + 'px'
      })
      .attr('y', function (d, i) {
        return SVG_HEIGHT - MARGIN.TOP - 10 + 'px'
      })
      .style('fill', function (d) {
        return 'green'
      })
      .transition()
      .duration(1000)
      .delay(function (d, i) {
        return i * 200
      })
      .attr('y', function (d, i) {
        return yScale(d) + MARGIN.TOP - 10 + 'px'
      })

  </script>
</body>
</html>
交互式操作
<!DOCTYPE html>
<html lang="en">

<head>
  <meta charset="UTF-8">
  <meta name="viewport" content="width=device-width, initial-scale=1.0">
  <meta http-equiv="X-UA-Compatible" content="ie=edge">
  <title>Document</title>
  <script src="https://d3js.org/d3.v5.min.js"></script>
  <style>
    #app {
      margin: 0 auto;
      width: 600px;
      height: 400px;
      background: #efefef;
      position: relative;
      margin: auto 0;
    }

    #tooltip {
      display: none;
      background: #666;
      color: white;
      border-radius: 6px;
      height: 50px;
      width: 80px;
      position: absolute;
      left: 0px;
      top: 0px;
      z-index: 1;
      transition: all 100ms;
    }

    .bar {
      fill: rgb(104, 152, 241);
      position: absolute;
      bottom: 100px;
    }

    .bar span {
      display: block;
      text-align: center;
    }

    .tool {
      text-align: center;
    }
  </style>
</head>

<body>
  <div id="tooltip">

  </div>
  <div style="text-align: center;">
    <svg id="app" style="width: 600px; height:400;"></svg>
  </div>
  <hr>
  <div class="tool">
    <button id="btn-sort">排序</button>
    <button id="btn-add">添加</button>
    <button id="btn-update">更新</button>
  </div>
  <script>

    const SVG_HEIGHT = 400;
    const SVG_WIDTH = 600;
    const MARGIN = { TOP: 30, RIGHT: 30, BOTTOM: 30, LEFT: 30 };

    //排序标记
    var sort_flag = false;

    //模拟数据
    var datalist = [20, 30, 40, 50, 15];

    //容器(画布)
    var container = d3.select("#app");

    //y轴线性比例尺
    var yScale = d3.scaleLinear()
      .domain([0, d3.max(datalist)])
      .range([SVG_HEIGHT - MARGIN.TOP - MARGIN.BOTTOM, 0]);
    var axisLeft = d3.axisLeft(yScale);

    //x轴,序数比例尺
    var xScale = d3.scaleBand()
      .domain(d3.range(datalist.length))
      .range([0, SVG_WIDTH - MARGIN.LEFT - MARGIN.RIGHT])
      .paddingInner(0.1);

    //x轴比例尺展示无意义
    var axisBottom = d3.axisBottom(xScale);
    axisBottom(
      container.append('g')
        .attr('transform', `translate(${MARGIN.LEFT},${SVG_HEIGHT - MARGIN.TOP})`))

    //添加左侧坐标轴
    axisLeft(
      container
        .append('g')
        .attr('transform', 'translate(30,30)')
    )


    function renderRect() {

      //添加新的rect
      container.selectAll('rect')
        .data(datalist)
        .enter()
        .append('rect')
        .classed('bar', true)
        .on('click', function (d) {
          let x = d3.event.pageX;
          let y = d3.event.pageY;
          d3.select("#tooltip")
            .style('display', 'block')
            .style('left', x + 'px')
            .style('top', y + 'px')
            .text(function () {
              return d;
            })
        })

      //更新样式
      container.selectAll('rect')
        .attr('x', function (d, i) {
          return xScale(i) + MARGIN.LEFT + 'px';
        })
        .attr('width', function (d, i) {
          return xScale.bandwidth() + 'px';
        })
        .style('height', function () {
          return '0px';
        })
        .attr('y', function (d, i) {
          return SVG_HEIGHT - MARGIN.TOP + 'px';
        })
        .on('mouseover', function () {
          d3.select(this).style('fill', 'orange');
        })
        .on('mouseout', function () {
          d3.select(this).style('fill', 'rgb(104, 152, 241)');
        })
        .transition()
        .duration(200)
        .delay(function (d, i) {
          return i * 100
        })
        .attr('y', function (d, i) {
          return yScale(d) + MARGIN.TOP + 'px';
        })
        .style('height', function (d, i) {
          return SVG_HEIGHT - MARGIN.TOP - MARGIN.BOTTOM - yScale(d) + 'px';
        })

    }

    function renderText() {

      container.append('g')
        .attr('class', 'textGrop');

      d3.select('.textGrop')
        .selectAll('text')
        .data(datalist)
        .enter()
        .append('text')
        .attr('text-anchor', 'middle')
        .text(function (d, i) {
          return d;
        });

      d3.select('.textGrop')
        .selectAll('text')
        .attr('x', function (d, i) {
          return xScale(i) + MARGIN.LEFT + xScale.bandwidth() / 2 + 'px';
        })
        .attr('y', function (d, i) {
          return SVG_HEIGHT - MARGIN.TOP - MARGIN.BOTTOM - 5 + 'px';
        })
        // .style('fill', function (d) {
        //   return 'red';
        // })
        .transition()
        .duration(200)
        .delay(function (d, i) {
          return i * 100;
        })
        .attr('y', function (d, i) {
          return yScale(d) + MARGIN.TOP - 5 + 'px';
        })
    }

    //刷新比例尺(当数据有变化时需要执行)
    function refreshScale() {
      yScale.domain([0, d3.max(datalist)]);
      xScale.domain(d3.range(datalist.length))
    }

    function sort() {
      container.selectAll('rect').sort((a, b) => {
        return sort_flag ? d3.descending(a, b) : d3.ascending(a, b);
      })
        .transition()
        .duration(500)
        .attr('x', (d, i) => {
          return xScale(i) + MARGIN.LEFT + 'px';
        })


      container.select('.textGrop')
        .selectAll('text').sort((a, b) => {
          return sort_flag ? d3.descending(a, b) : d3.ascending(a, b);
        })
        .text(function (d, i) {
          return d;
        })
        .transition()
        .duration(500)
        .attr('x', (d, i) => {
          return xScale(i) + MARGIN.LEFT + xScale.bandwidth() / 2 + 'px';
        })

      sort_flag = !sort_flag;

    }

    function initEvent() {
      d3.select("#btn-sort").on('click', () => {
        sort();
      })

      d3.select("#btn-add").on('click', () => {
        let num = Math.ceil(Math.random() * 100);
        datalist.push(num);
        refreshScale();
        renderRect();
        renderText();
      })


      d3.select("#btn-update").on('click', () => {
        mockData();
        refreshScale();
        renderRect();
        renderText();
      })
    }

    function mockData() {
      datalist = [];
      for (let i = 0; i < 10; i++) {
        let num = Math.ceil(Math.random() * 100);
        this.datalist.push(num);
      }
    }

    renderRect();
    renderText();
    initEvent();

  </script>

</body>

</html>
饼状图
模拟数据 data.csv
education,population
大专以及以上,11964
高中和中专,18799
初中,51966
小学,35876
文盲人口,5466
<!DOCTYPE html>
<html lang="en">

<head>
  <meta charset="UTF-8">
  <meta name="viewport" content="width=device-width, initial-scale=1.0">
  <meta http-equiv="X-UA-Compatible" content="ie=edge">
  <title>Document</title>
  <script src="./d3.v5.min.js"></script>
</head>

<body>
  <div id="container"></div>

  <script>
    d3.csv("data.csv", function (d) {
      return {
        education: d.education,
        population: +d.population,
      }
    }).then(data => {
      console.log(data);
      var sum = d3.sum(data.map(function (d) {
        return d.population
      }))

      for (i in data) {
        data[i].Percentage = (data[i].population / sum * 100).toFixed(0) + "%";
      }
      console.log(data);

      var width = 800,
        height = 800,
        margin = { "left": 30, "top": 30, "right": 30, "bottom": 30 },
        svg_width = width + margin.left + margin.right,
        svg_height = height + margin.top + margin.bottom,
        font_size = 15;

      var svg = d3.select("#container")
        .append("svg")
        .attr("width", width)
        .attr("height", height)


      var Pie = svg.append("g")
        .attr("transform", "translate(" + width / 2 + "," + height / 2 + ")")

      var arc_generator = d3.arc()
        .innerRadius(width / 8)
        .outerRadius(width / 4)
      // .startAngle(0)
      // .endAngle(120*Math.PI/180);

      var angle_data = d3.pie()
        .value(function (d) {
          return d.population;
        })
      console.log(angle_data(data));

      var color = d3.schemeCategory10;
      console.log(color)

      //生成内部圆环
      Pie.selectAll("path")
        .data(angle_data(data))
        .enter()
        .append("path")
        .attr("d", arc_generator)
        .style("fill", function (d, i) {
          return color[i];
        })
        .attr("class", ".path")

      //标注
      var arc_label = d3.arc()
        .innerRadius(width / 4)
        .outerRadius(width / 2)

      Pie.selectAll(".arc_label")
        .data(angle_data(data))
        .enter()
        .append("path")
        .attr("d", arc_label)
        .attr("class", ".arc_label")
        .style("fill", "none")

      //画标注线
      function line_label(angle_data) {
        var str = ""
        var i = -0;
        for (d in angle_data) {
          str = "M" + arc_generator.centroid(angle_data[d])[0] + "," + arc_generator.centroid(angle_data[d])[1];
          str = str + "L" + arc_label.centroid(angle_data[d])[0] + "," + arc_label.centroid(angle_data[d])[1]
          // console.log(str);
          Pie.append("path")
            .attr("d", str)
            .attr("stroke", color[i])
            .attr("stroke-width", 2)
          i++;
          if (i > 10) i = 0;
        }
      }

      line_label(angle_data(data));

      var text = Pie.selectAll("text")
        .data(angle_data(data))
        .enter()
        .append("text")
        .attr("transform", function (d) {
          return "translate(" + arc_label.centroid(d) + ")"
        })
        .attr("text-anchor", function (d) {
          var x = arc_label.centroid(d)[0];
          return x <= 0 ? "end" : "start";
        })
        .attr("font-size", font_size)
        .style("fill", function (d, i) {
          return color[i];
        })
        .style("text-decoration", "underline")
        .text(function (d) {
          return d.data.education + d.data.Percentage;
        })
    })
  </script>
</body>

</html>
散点图
<!DOCTYPE html>
<html lang="en">

<head>
  <meta charset="UTF-8">
  <meta name="viewport" content="width=device-width, initial-scale=1.0">
  <meta http-equiv="X-UA-Compatible" content="ie=edge">
  <title>Document</title>
  <script src="./d3.v5.min.js"></script>
</head>

<body>
  <div id="app">


  </div>
  <hr>
  <button id="btn-update">update</button>


  <script>

    const svg_width = 600;
    const svg_height = 450;
    const padding = 30;
    const colors = d3.schemeCategory10;

    var container = d3.select("#app");
    //生成画布
    var svg = container.append('svg')
      .attr('width', svg_width)
      .attr('height', svg_height)
      .style('background', '#efefef');


    //生成模拟数据
    var dataset = [];
    function mockData() {
      dataset = [];
      for (let i = 0; i < 10; i++) {
        let x = Math.ceil(Math.random() * 400);
        let y = Math.ceil(Math.random() * 400);
        dataset.push({
          x,
          y
        })
      }
    }
    mockData();


    //添加散点
    function addCircle() {
      svg
        .append('g')
        .attr('class', 'grop_circle')
        .attr('clip-path', 'url(#rect-clip-path)')
        .selectAll('circle')
        .data(dataset)
        .enter()
        .append('circle')
        .attr('r', 15)
        .attr('cx', (d, i) => {
          return d.x;
        })
        .attr('cy', (d, i) => {
          return d.y;
        })
        .attr('fill', (d, i) => {
          return colors[i]
        })
      // .
      // on('click', function (d) {
      //   alert(d.x);
      // })

    }
    addCircle();


    //添加坐标轴
    function addAxis() {
      //x轴的线性比例尺
      this.x_scale = d3.scaleLinear()
        .domain([0, d3.max(dataset, (d) => {
          return d.x;
        })])
        .range([0, svg_width - padding * 2]);

      //y轴的线性比例尺
      this.y_scale = d3.scaleLinear()
        .domain([0, d3.max(dataset, (d) => {
          return d.y;
        })])
        .range([svg_height - padding * 2, 0]);

      //x方向坐标轴
      this.x_axis = d3.axisBottom(x_scale)
      svg.append('g')
        .attr('id', 'x_axis')
        .call(this.x_axis)
        .attr('transform', `translate(${padding},${svg_height - padding})`);

      //y方向坐标轴
      this.y_axis = d3.axisLeft(y_scale)
      svg.append('g')
        .attr('id', 'y_axis')
        .call(y_axis)
        .attr('transform', `translate(${padding},${padding})`);

    }
    addAxis();

    //添加裁切路径
    function addClipPath() {
      svg.
        append('clipPath')
        .attr('id', 'rect-clip-path')
        .append('rect')
        .attr('x', padding)
        .attr('y', padding)
        .attr('width', svg_width - padding * 2)
        .attr('height', svg_height - padding * 2);

    }
    addClipPath();

    //数据更新
    d3.select("#btn-update").on('click', () => {
      mockData();

      //更新坐标轴
      x_scale.domain([0, d3.max(dataset, (d) => {
        return d.x;
      })])

      y_scale.domain([0, d3.max(dataset, (d) => {
        return d.y;
      })])

      this.x_axis = d3.axisBottom(x_scale)
      svg.select("#x_axis")
        .transition()
        .duration(500)
        .call(this.x_axis);
      svg.select("#y_axis")
        .transition()
        .duration(500)
        .call(this.y_axis);


      svg.select('.grop_circle')
        .selectAll('circle')
        .data(dataset)
        .transition()
        .duration(500)
        .attr('cx', (d, i) => {
          return d.x;
        })
        .attr('cy', (d, i) => {
          return d.y;
        })
        .attr('fill', (d, i) => {
          return colors[i]
        })
    })


  </script>
</body>
</html>
地图可视化
在数据可视化中,地图是很重要的一部分。很多情况会与地图有关联,如中国各省的人口多少,GDP多少等,都可以和地图联系在一起。
D3地图绘制 制作地图需要 JSON 文件,将 JSON 的格式应用于地理上的文件,叫做 GeoJSON 文件。
投影函数
var projection = d3.geo.mercator()//投影函数
        .center([107, 31])//设定地图的中心位置--经度和纬度
        .scale(850)//设定放大的比例
        .translate([width/2, height/2]);//设定平移
由于 GeoJSON 文件中的地图数据,都是经度和纬度的信息。它们都是三维的,而要在网页上显示的是二维的,所以要设定一个投影函数来转换经度纬度。如上所示,使用 d3.geo.mercator() 的投影方式。
地理路径生成器 为了根据地图的地理数据生成 SVG 中 path 元素的路径值,需要用到 d3.geo.path(),称为地理路径生成器。
var path = d3.geo.path()
    .projection(projection);
projection() 是设定生成器的投影函数,把上面定义的投影传入即可。
案例
index.html
<!DOCTYPE html>
<html lang="en">

<head>
  <meta charset="UTF-8">
  <meta name="viewport" content="width=device-width, initial-scale=1.0">
  <meta http-equiv="X-UA-Compatible" content="ie=edge">
  <title>Document</title>
  <script src="http://d3js.org/d3.v5.min.js"></script>
  <script src="./map.js"></script>
  <style>
    #tooltip {
      text-align: center;
      padding: 20px;
      margin: 10px;
      font: 12px sans-serif;
      background: lightsteelblue;
      border: 1px;
      border-radius: 2px;
      pointer-events: none;
      position: absolute;
      left: -20px;
      top: -20px;
      z-index: 1;
      border: 1px solid grey;
      border-radius: 5px;
      font-size: 12px;
      width: auto;
      padding: 4px;
      color: white;
    }

    #tooltip h4 {
      margin: 0;
      font-size: 14px;
    }

    #tooltip table {
      table-layout: fixed;
    }

    #tooltip tr td {
      padding: 0;
      margin: 0;
    }

    #tooltip tr td:nth-child(1) {
      width: 50px;
    }

    #tooltip tr td:nth-child(2) {
      text-align: center;
    }
  </style>
</head>

<body>
  <div id="tooltip"></div>
  <div id="container"></div>
  <script>

    function tooltipHtml(d) {
      return "<h4>" + d.properties.name + "</h4><table>" +
        "<tr><td>Low</td><td>" + (d.properties.adcode) + "</td></tr>" +
        "<tr><td>Average</td><td>" + (d.properties.center) + "</td></tr>" +
        "<tr><td>High</td><td>" + (d.properties.centroid) + "</td></tr>" +
        "</table>"
    }

    d3.json('./china.json').then((result) => {
      // console.log(result);
      map('#container', result, function (d) {
        d3.select("#tooltip").html(
          tooltipHtml(d, event)
        )
        .style("left", (d3.event.pageX) + "px")
        .style("top", (d3.event.pageY - 28) + "px")
      })
    })
  </script>
</body>

</html>
map.js
function map(id, data, clickCbk) {
  const width = 1000;
  const height = 1000;

  // 画布
  const svg = d3
    .select(id)
    .append('svg')
    .attr('width', width)
    .attr('height', height)

  //投影方式。
  const projection = d3
    //投影函数,地理投影,可将经纬度转成平面坐标系
    .geoMercator()
    //设定地图的中心位置--经度和纬度
    .center([107, 31])
    //设定放大的比例
    .scale(800)
    //设定平移
    .translate([width / 2, height / 2]);

  const path = d3.geoPath().projection(projection);
  const color = d3.schemeCategory10;

  svg
    .selectAll('g')
    .data(data.features)
    .enter()
    .append('g')
    .append('path')
    .attr('d', path)
    .attr('stroke', '#000')
    .attr('stroke-width', 1)
    .attr('opacity', 0.6)
    .attr('fill', function (d, i) {
      return color[i % 10]
    })
    .on('click', function (d, i) {
      console.log(d);
      clickCbk(d, d3.event);
    })
    .on('mouseover', function () {
      d3.select(this).attr('opacity', 1);
    })
    .on('mouseout', function () {
      d3.select(this).attr('opacity', 0.6);
    });

  // 添加坐标
  svg
    .selectAll('g')
    .append('text')
    .attr('font-size', 12)
    .attr('text-anchor', 'middle')
    .attr('x', d => {
      const position = projection(d.properties.centroid || [0, 0]);
      return position[0];
    })
    .attr('y', d => {
      const position = projection(d.properties.centroid || [0, 0]);
      return position[1];
    })
    .attr('dy', d => {
      //这里为什么这么写呢,因为澳门和香港重合了,挤到一起了。
      if (d.properties.name === '澳门') {
        return 15;
      }
    })
    .text(d => d.properties.name);
}
china.json
{
  "type": "FeatureCollection",
  "features": [{
    "type": "Feature",
    "properties": {
      "adcode": 110000,
      "name": "北京市",
      "center": [116.405285, 39.904989],
      "centroid": [116.41989, 40.189913],
      "childrenNum": 16,
      "level": "province",
      "subFeatureIndex": 0,
      "acroutes": [100000],
      "parent": {
        "adcode": 100000
      }
    },
    "geometry": {
      "type": "MultiPolygon",
      "coordinates": [
        [
          [
            [117.210024, 40.082262],
            [117.105315, 40.074479],
            [117.105315, 40.074479],
            [117.102851, 40.073563],
            [117.102235, 40.073105],
            [117.102235, 40.073105],
            [117.102851, 40.073563],
            [116.999989, 40.030053],
            [116.927924, 40.054788],
            [116.783794, 40.035093],
            [116.757925, 39.968176],
            [116.786874, 39.886963],
            [116.926076, 39.835524],
            [116.949482, 39.778529],
            [116.902055, 39.763813],
            [116.90575, 39.687883],
            [116.812128, 39.616018],
            [116.717273, 39.603572],
            [116.717273, 39.603572],
            [116.720969, 39.599884],
            [116.720969, 39.599884],
            [116.726512, 39.595274],
            [116.726512, 39.595274],
            [116.703106, 39.588819],
            [116.703106, 39.588819],
            [116.607636, 39.619705],
            [116.524484, 39.596657],
            [116.440716, 39.527466],
            [116.433325, 39.44296],
            [116.332927, 39.457744],
            [116.245464, 39.515466],
            [116.204196, 39.588819],
            [116.10195, 39.576368],
            [116.10195, 39.576368],
            [115.957204, 39.561147],
            [115.910393, 39.600345],
            [115.910393, 39.600345],
            [115.855574, 39.554689],
            [115.855574, 39.554689],
            [115.846951, 39.550999],
            [115.846951, 39.550999],
            [115.821081, 39.517312],
            [115.821081, 39.517312],
            [115.752712, 39.512696],
            [115.752712, 39.512696],
            [115.738545, 39.539464],
            [115.738545, 39.539925],
            [115.738545, 39.539464],
            [115.738545, 39.539925],
            [115.737314, 39.544078],
            [115.737314, 39.544078],
            [115.723763, 39.544539],
            [115.723763, 39.544539],
            [115.721299, 39.543617],
            [115.721299, 39.543617],
            [115.721299, 39.55146],
            [115.721299, 39.55146],
            [115.716988, 39.560225],
            [115.716988, 39.560225],
            [115.699125, 39.577751],
            [115.698509, 39.577751],
            [115.698509, 39.577751],
            [115.699125, 39.577751],
            [115.698509, 39.577751],
            [115.69543, 39.579135],
            [115.69543, 39.579135],
            [115.586408, 39.58928],
            [115.478619, 39.650578],
            [115.478619, 39.650578],
            [115.498945, 39.69617],
            [115.498945, 39.69617],
            [115.443511, 39.785426],
            [115.443511, 39.785426],
            [115.567314, 39.816224],
            [115.514344, 39.837821],
            [115.522967, 39.898898],
            [115.426264, 39.95029],
            [115.454597, 40.029595],
            [115.599343, 40.11979],
            [115.73485, 40.129398],
            [115.773038, 40.176044],
            [115.85311, 40.148609],
            [115.89869, 40.234536],
            [115.968907, 40.264219],
            [115.9184, 40.354103],
            [115.861733, 40.364589],
            [115.861733, 40.364589],
            [115.779197, 40.442501],
            [115.755792, 40.540333],
            [115.907929, 40.617133],
            [116.005247, 40.58397],
            [116.088399, 40.62667],
            [116.22021, 40.744181],
            [116.247311, 40.791762],
            [116.464738, 40.771827],
            [116.334159, 40.90446],
            [116.473977, 40.895867],
            [116.455499, 40.98084],
            [116.519557, 40.981292],
            [116.519557, 40.981292],
            [116.599013, 40.974516],
            [116.615643, 41.053072],
            [116.688324, 41.044499],
            [116.677853, 40.970902],
            [116.730208, 40.897676],
            [116.858323, 40.833423],
            [116.964881, 40.70972],
            [117.110858, 40.70836],
            [117.286401, 40.660719],
            [117.386799, 40.684317],
            [117.49582, 40.674334],
            [117.389879, 40.5617],
            [117.344299, 40.582152],
            [117.213104, 40.512136],
            [117.225423, 40.369148],
            [117.309191, 40.279284],
            [117.309807, 40.279284],
            [117.309191, 40.279284],
            [117.309807, 40.279284],
            [117.389879, 40.228141],
            [117.367089, 40.172387],
            [117.367089, 40.172844],
            [117.367089, 40.173301],
            [117.367089, 40.173301],
            [117.367089, 40.172844],
            [117.367089, 40.172387],
            [117.344299, 40.13443],
            [117.210024, 40.082262]
          ]
        ]
      ]
    }
  }
  //...
]}